This is where navigation should be.
GSP_BUNNY - Create a graph of the stanford bunny
Usage
: G = gsp_bunny();
Output parameters
| G | Resulting graph |
Description
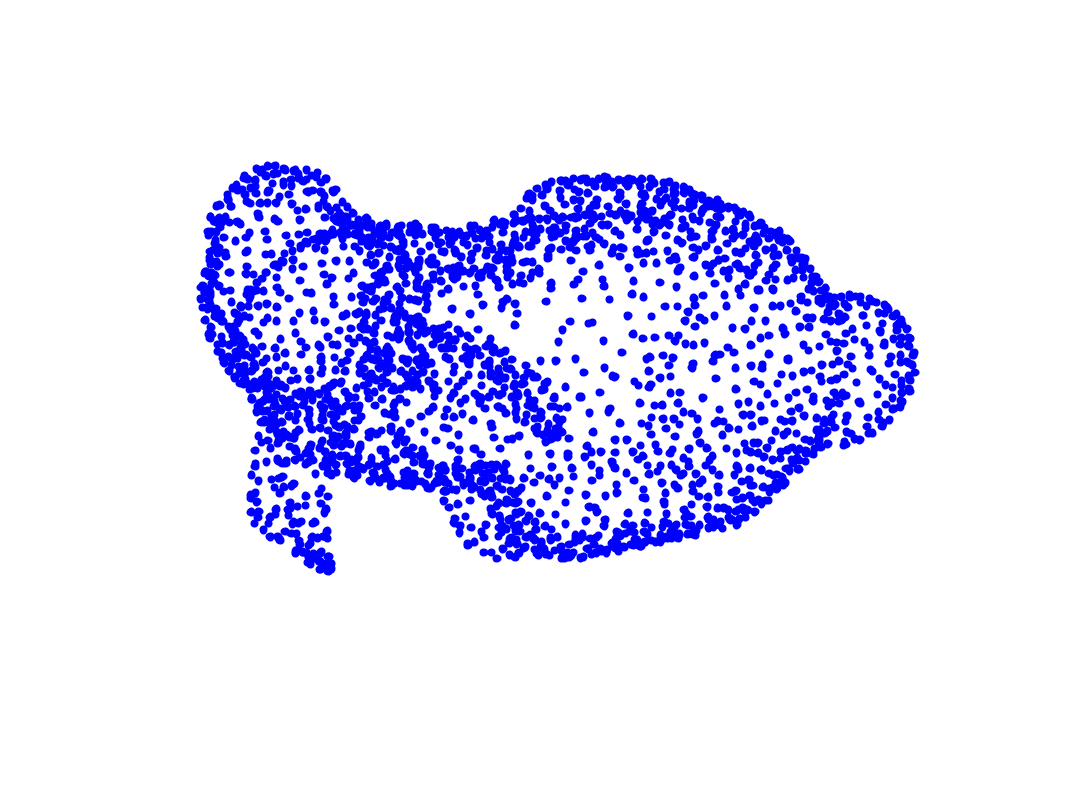
'gsp_bunny()' creates a graph from the pointcloud of the Stanford Bunny model.
Example:
G = gsp_bunny();
gsp_plot_graph(G);
References:
G. Turk and M. Levoy. Zippered polygon meshes from range images. In Proceedings of the 21st annual conference on Computer graphics and interactive techniques, pages 311--318. ACM, 1994.