This is where navigation should be.
GSP_CUBE - Create a graph corresponding to the sampling of an hyper-cube
Usage
:  G = gsp_cube();
G = gsp_cube( param );
Input parameters
| param | Structure of optional parameters |
Output parameters
| G | Resulting graph |
Description
'gsp_cube( param )' creates a graph from points sampled on a hyper-cube. The dimension of the cube can be passed as a parameter. It can be sampled in a uniform voxel grid or randomly.
Additional parameters
- param.radius : float the edge length
- param.nb_pts : int the number of vertices
- param.nb_dim : int the dimension
- param.sampling : ['random'] the variance of the distance kernel
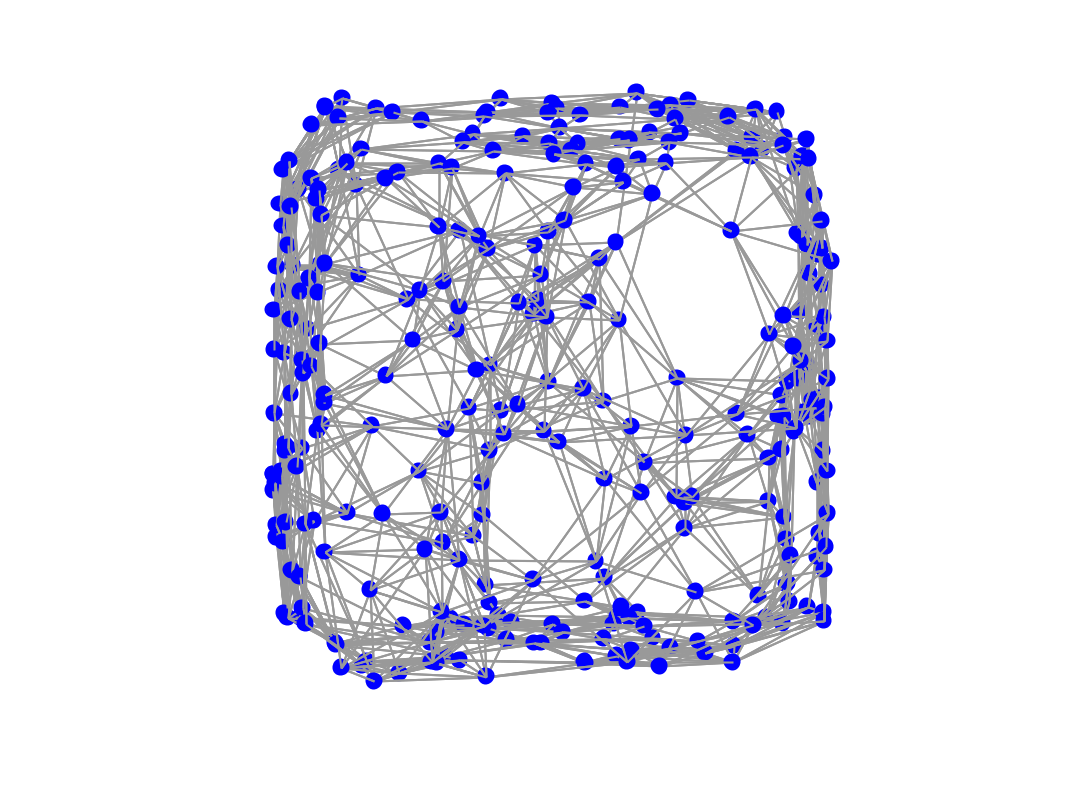
Example:
G = gsp_cube();
gsp_plot_graph(G);
axis square