This is where navigation should be.
GSP_SENSOR - Create a random sensor graph
Usage
G = gsp_sensor(N);
G = gsp_sensor( );
G = gsp_sensor(N, param);
Input parameters
- - N
- Number of nodes (default 128)
- - param
- Structure of optional parameters
Output parameters
- - G
- Graph
Description
This function creates a 2 dimensional random sensor graph. All the coordinates are between 0 and 1.
param is an optional structure with the following field
- param.verbose: display parameter - 0 no log - 1 display the errors (default 1)
- param.N_try: Number of attempts to create the graph (default 10)
- param.distribute: To distribute the points more evenly (default 0)
- param.connected: To force the graph to be connected (default 1)
- param.nnparam: optional parameter for the gsp_nn_graph
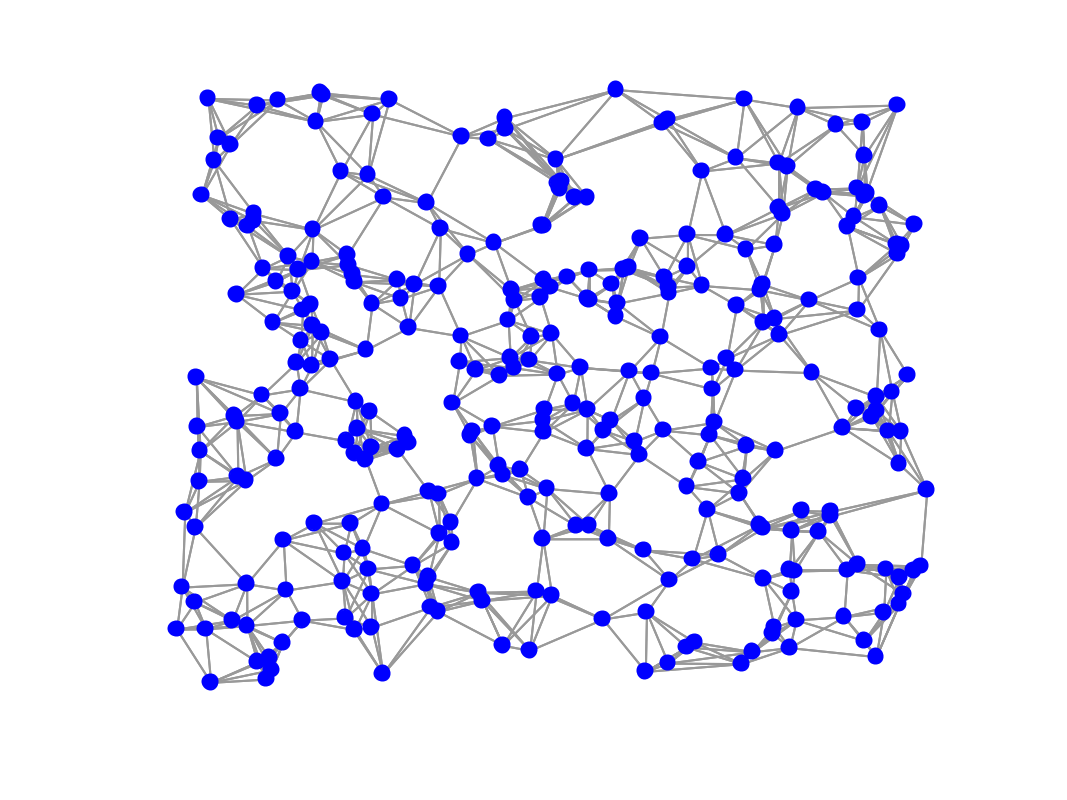
Example:
G = gsp_sensor(300);
paramplot.show_edges = 1;
gsp_plot_graph(G,paramplot);