This is where navigation should be.
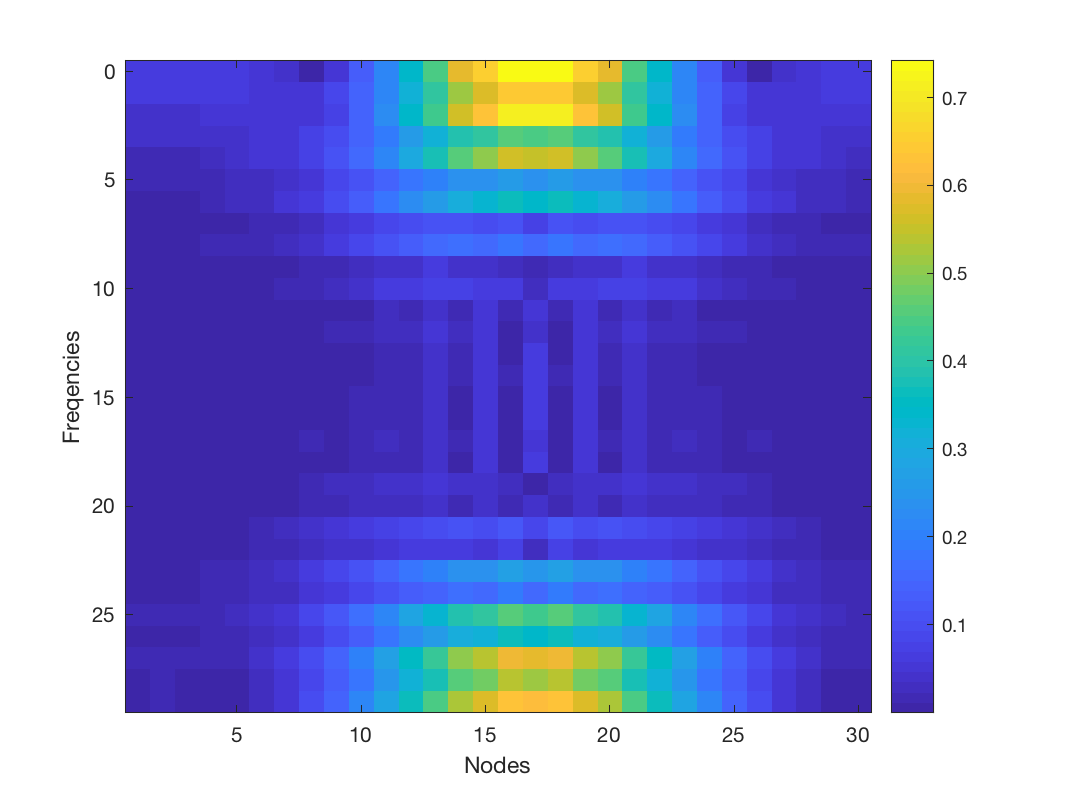
GSP_PLOT_SGRAM - Plot graph spectrogram
Usage
gsp_plot_sgram( G,A );
gsp_plot_sgram( G,A,param );
Input parameters
| G | Graph |
| A | Graph windowed Fourrier transform |
| param | Structure of optional parameter |
Output parameters
non none
Description
param is a structure of optional parameter with
- param.colorbar: Use the colorbar (default 1)
Example:
N = 15;
G = gsp_ring(2*N);
G = gsp_compute_fourier_basis(G);
x = [0:N,(N-1):-1:1]';
s = 3;
g = exp(-(x-1).^2/s^2);
f = gsp_localize(G,g,N);
c = gsp_gwft(G,f,g);
gsp_plot_sgram(G,c);
