This is where navigation should be.
GSP_PLOT_SIGNAL - Plot a graph signal in 2D or 3D
Usage
gsp_plot_signal(G,signal);
gsp_plot_signal(G,signal,param);
Input parameters
| G | Graph structure. |
| signal | Graph signal. |
| param | Optional variable containing additional parameters. |
Output parameters
non none
Description
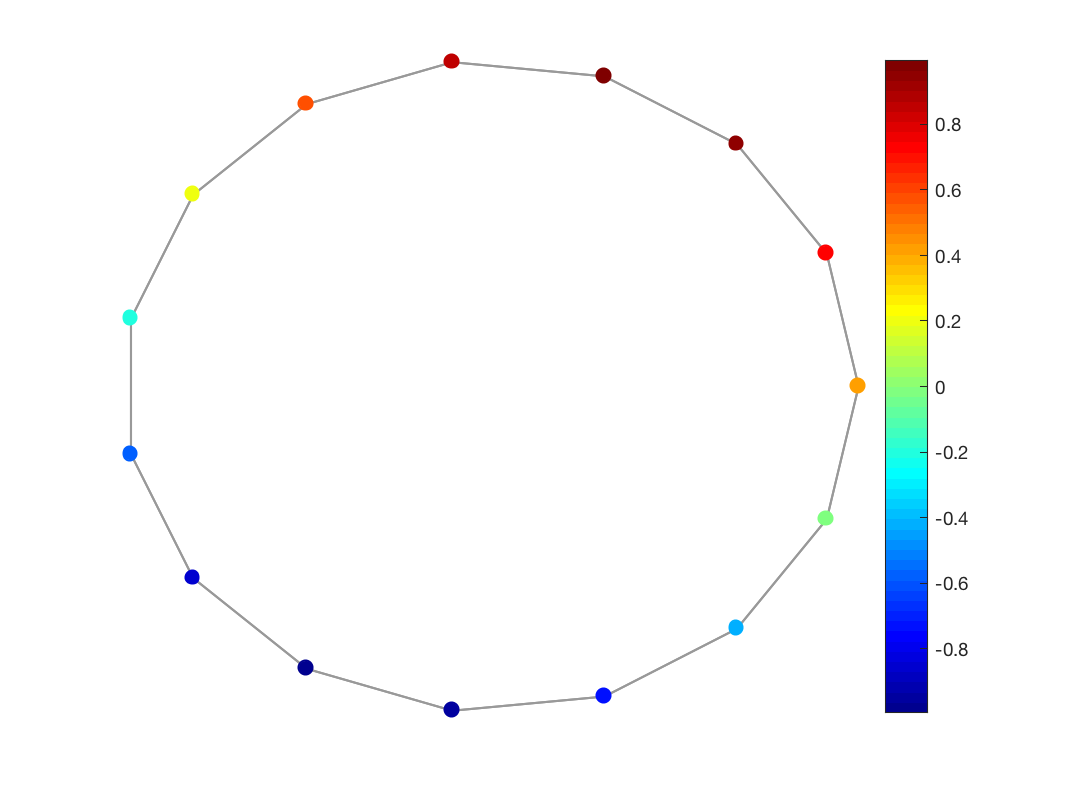
'gsp_plot_signal(G,f)' plots a graph signal in 2D or 3D, using the adjacency matrix (G.A), the plotting coordinates (G.coords), the coordinate limits (G.plotting.limits), the edge width (G.plotting.edge_width), the edge color (G.plotting.edge_color), the edge style (G.plotting.edge_style), and the vertex size (G.vertex_size).
Example:
G = gsp_ring(15);
f = sin((1:15)*2*pi/15);
gsp_plot_signal(G,f)

Additional parameters
- param.show_edges : Set to 0 to only draw the vertices. (default G.Ne < 10000 )
- param.cp : Camera position for a 3D graph.
- param.vertex_size: Size of circle representing each signal component.
- param.colorbar : Set to 0 to not show the colorbar
- param.climits : Limits of the colorbar
- param.vertex_highlight: Vector of indices of vertices to be highlighted
- param.bar : 1 Display bar for the graph. 0 Display color
- points. (default 0);
- param.bar_width : Width of the bar (default 1)
- param.clear : Clear axes (default 1)