EXPERIMENT_MOLENE_TEMPERATURE - In-painting on the Molene temperature dataset
Description
Authors: Nathanael Perraudin and Pierre Vandergheynst
Date: January 2016
Paper: Stationary signal processing on graphs
Abstract of the paper
Graphs are a central tool in machine learning and information processing as they allow to conveniently capture the structure of complex datasets. In this context, it is of high importance to develop flexible models of signals defined over graphs or networks. In this paper, we generalize the traditional concept of wide sense stationarity to signals defined over the vertices of arbitrary weighted undirected graphs. We show that stationarity is intimately linked to statistical invariance under a localization operator reminiscent of translation. We prove that stationary signals are characterized by a well-defined Power Spectral Density that can be efficiently estimated even for large graphs. We leverage this new concept to derive Wiener-type estimation procedures of noisy and partially observed signals and illustrate the performance of this new model for denoising and regression.
Dataset
The French national meteorological service has published in open access a dataset with hourly weather observations collected during the Month of January 2014 in the region of Brest (France). From these data, we wish to ascertain that our method still performs better than the two other models (TV and Tikonov) on real measurements. The graph is built from the coordinates of the weather stations by connecting all the neighbours in a given radius with a weight function \(w(i,j) = e^{-d^2\tau}\) where \(\tau\) is adjusted to obtain a average degree around \(3\) (\(\tau\), however, is not a sensitive parameter). For our experiments, we consider every time step as an independent realization of a WSS process. As sole pre-processing, we remove the mean of the temperature. Thanks to the \(744\) time observation, we can estimate the covariance matrix and check wether the process is stationary on the graph.
This experiment
The result of the experiment with temperature is displayed in Figures 1 and 2. The covariance matrix shows a strong correlation between the different weather stations. Diagonalizing it with the Fourier basis of the graph assesses that the meteorological instances are more or less stationary within the distance graph by highlighting its diagonal characteristic. Moreover this diagonal gives us access to the PSD of the data. In our experiment, we solve an in-painting/de-noising problem with a mask operator covering 50 per cent of measurements and various amount of noise. We then average the result over \(744\) experiments (corresponding to the \(744\) observations) to obtain the curves displayed in Figure 2. We observe that Wiener optimization performs significantly better when the noise level is high and equivalently well to the two other methods for low noise level.
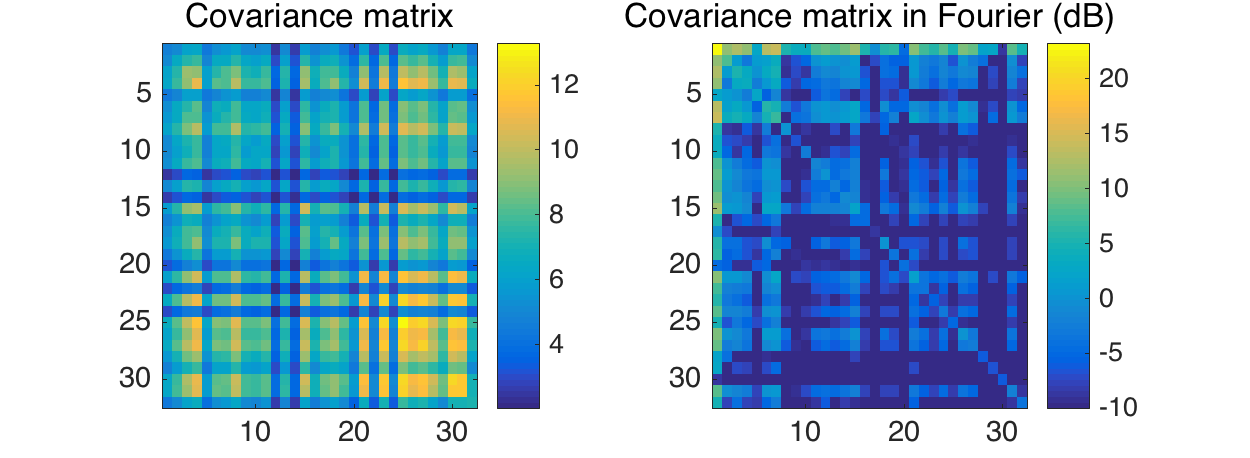
Covariance matrices.
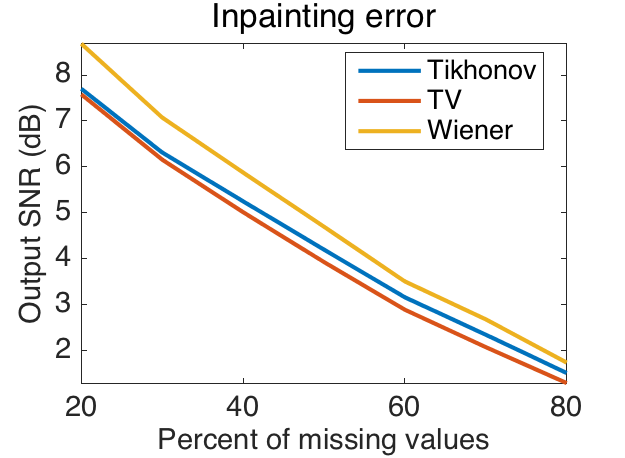
Recovery errors for different noise levels.
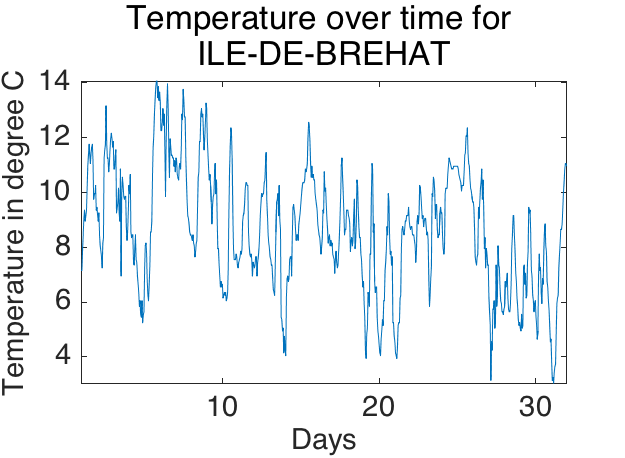
The temperature of the Island of Brehat.
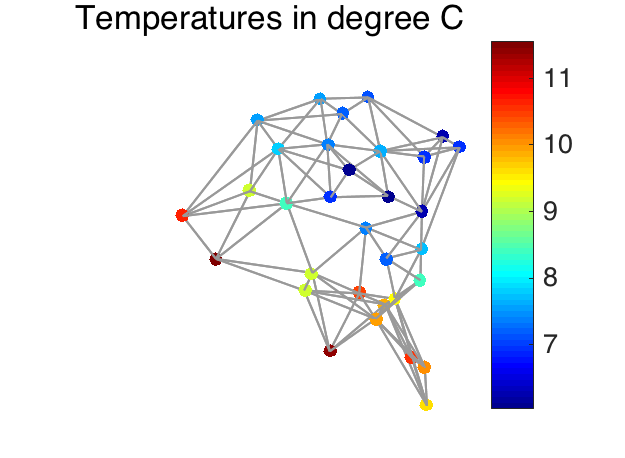
An example of the process on the graph (first measure).
This code produces the following output:
The stationarity ratio is: 9.400517e-01
References:
N. Perraudin and P. Vandergheynst. Stationary signal processing on graphs. In Infoscience - EPFL, 2016.