This is where navigation should be.
GSP_PLOT_SIGNAL_SPECTRAL - Plot a graph signal in the graph spectral domain
Usage
gsp_plot_signal_spectral(G,signal);
gsp_plot_signal_spectral(G,signal,param);
Input parameters
| G | Graph or laplacian eigenvalues |
| f_hat | Graph signal in the spectral domain. |
| param | Optional variable containing additional parameters. |
Output parameters
non none
Description
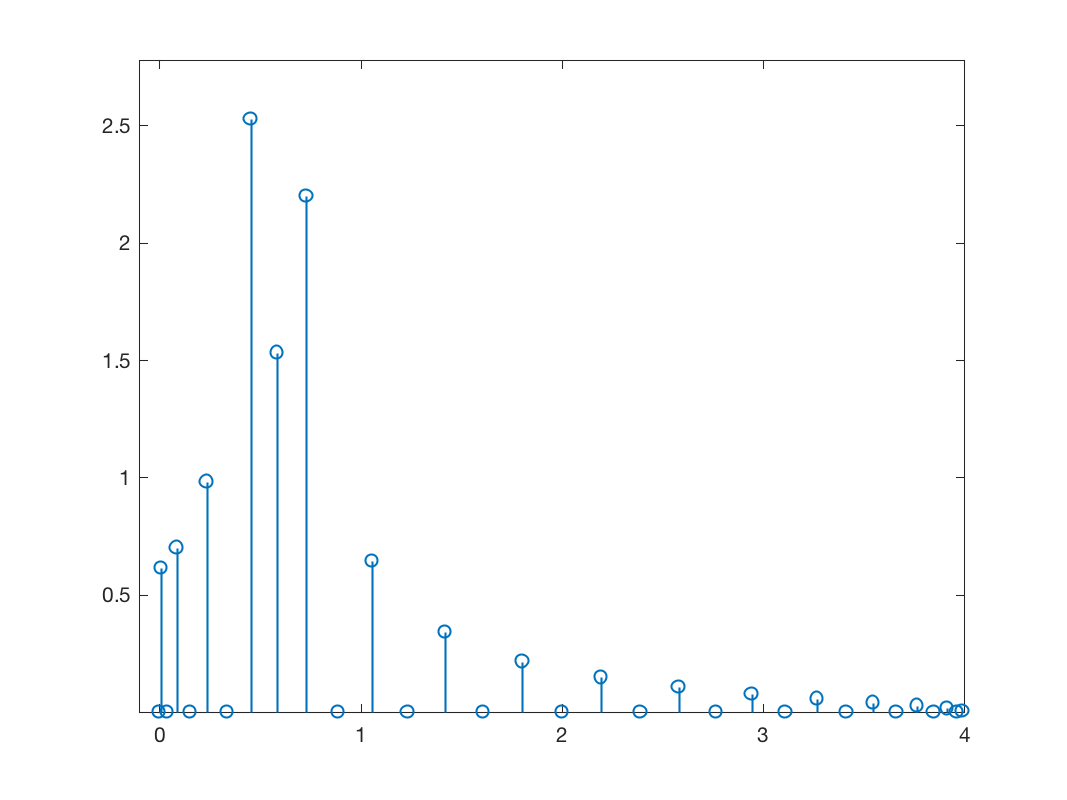
'gsp_plot_signal_spectral(G,signal)' plots a graph signal in the graph Fourier domain.
Warning: to use this function, the Fourier basis of the graph should be first computed. You can do it with:
G = gsp_full_eigen(G);
Example:
N = 32;
G = gsp_path(N);
G = gsp_compute_fourier_basis(G);
f = sin((1:N)'*2*pi*4/N);
fhat = gsp_gft(G,f);
gsp_plot_signal_spectral(G,fhat);

Additional parameters
- param.highlight : Highlight one frequency component.
- param.plot_abs : Option to plot the absolute value of f_hat